

Announcing the brand new Equipe Reporting Suite.
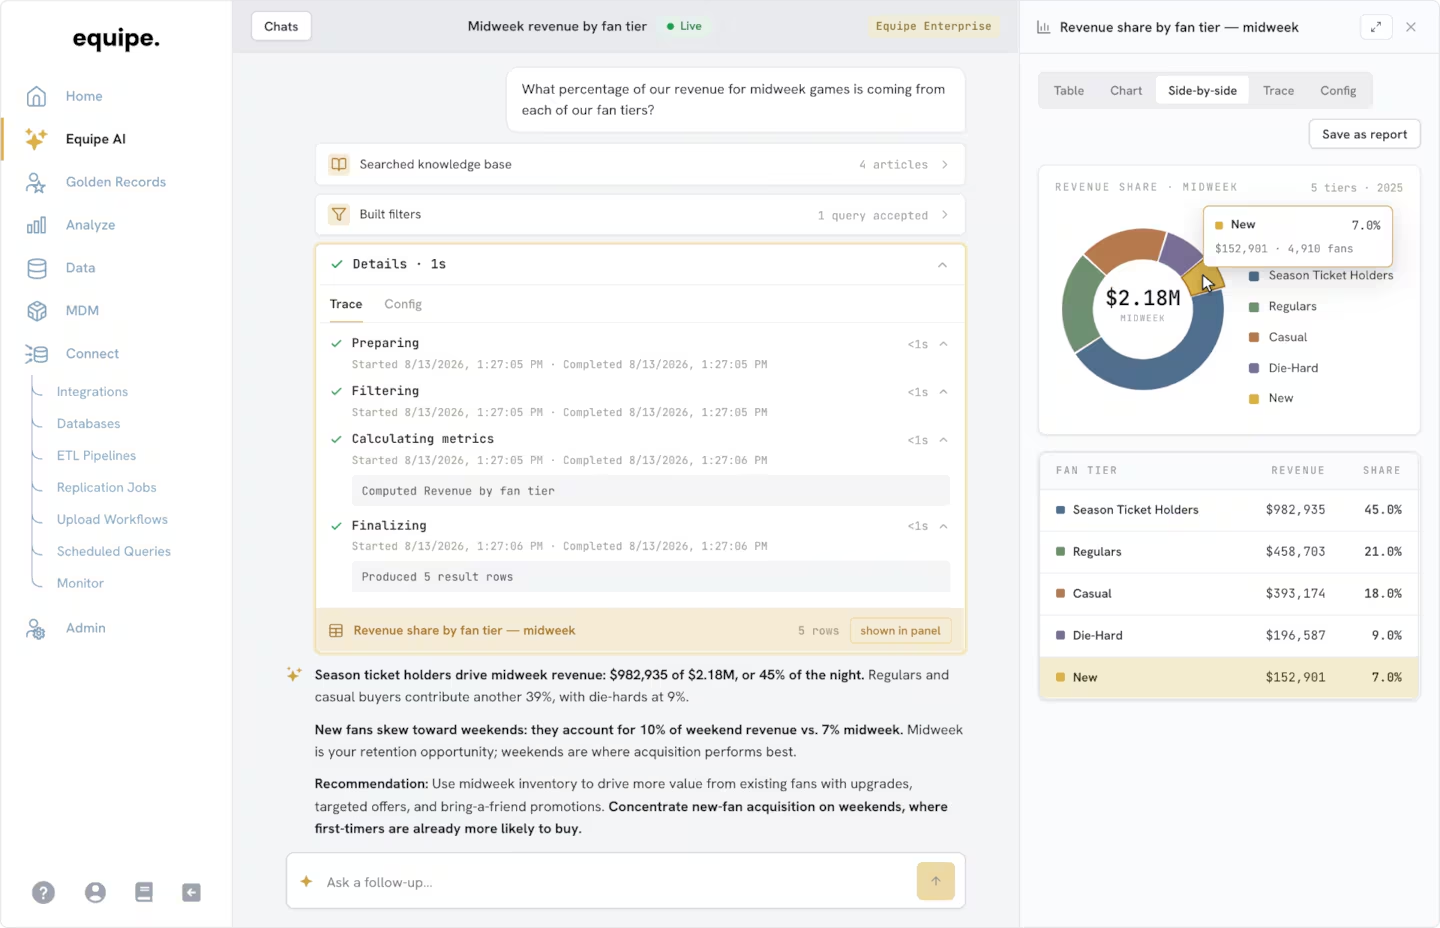
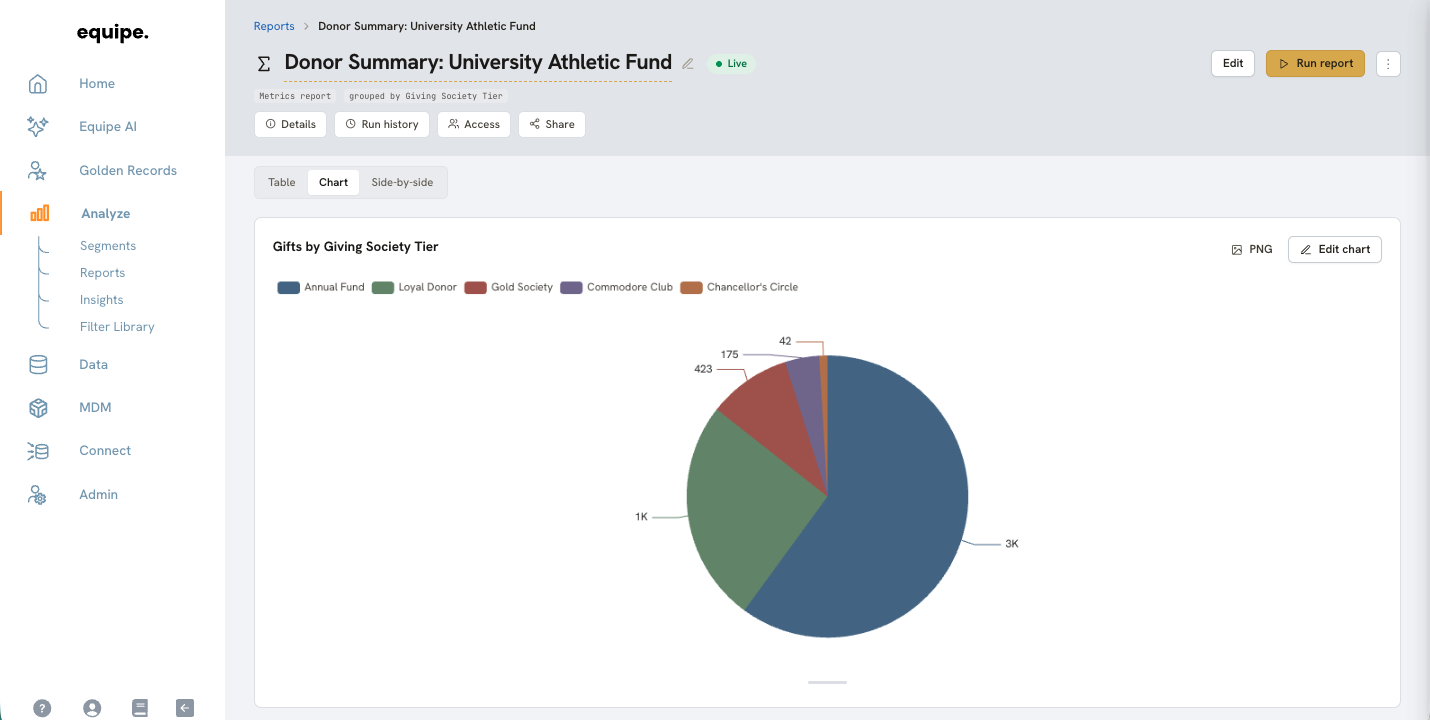
Equipe now lets you do almost everything you'd go to a tool like Tableau or Power BI for, right on top of your clean, unified data. Your reports run directly on your clean, unified data, they're easy to share across your team, and, most importantly, they're genuinely intuitive to build.
A few of the things you can now do:
- Build any report step by step in a brand-new, guided builder.
- Filter at every level, from the whole report down to individual metrics and results.
- Calculate flexible metrics with complex arithmetic, conditionals, and year-over-year comparisons.
- Sort, order, and limit your results to surface exactly what matters.
- Explore your results in an interactive table and export them to CSV.
For a little inspiration, here are just a few reports you can now build in minutes:
- Season ticket renewal dashboards
- Complex upsell lists
- Campaign attribution and performance tracking
- Face value vs. secondary market price by section
Whether you're pulling a quick list of records or building a grouped metrics report with year-over-year comparisons, activating your data has never been easier. The new Reporting Suite lets everyone across your team work with data, from analysts to executives. Anyone can log in, build the report they need, and share their findings across the organization, all in one place.
Check out the video below for a demo of what the new Reporting Suite can do. 👇